***This is a personal project made for demonstration purposes***
Task-Plot is a web-based geospatial task management application. Users can plot points over a base layer and assign task information to them. Tasks can be viewed individually in popups displayed by clicking on individual points or in a table available in the main menu. Other potential capabilities include adding layers by uploading shapefiles (i.e., shapefiles) and setting layer symbology. Being a web app, multiple users can view and edit task data in real-time whether on mobile or desktop devices. Users are joined into groups with data separate from other groups. This app utilizes the Leaflet open-source library for geospatial tools and PostgreSQL for data storage.
A single user account is available for exploring the app. Thank you for your interest in Task-Plot!


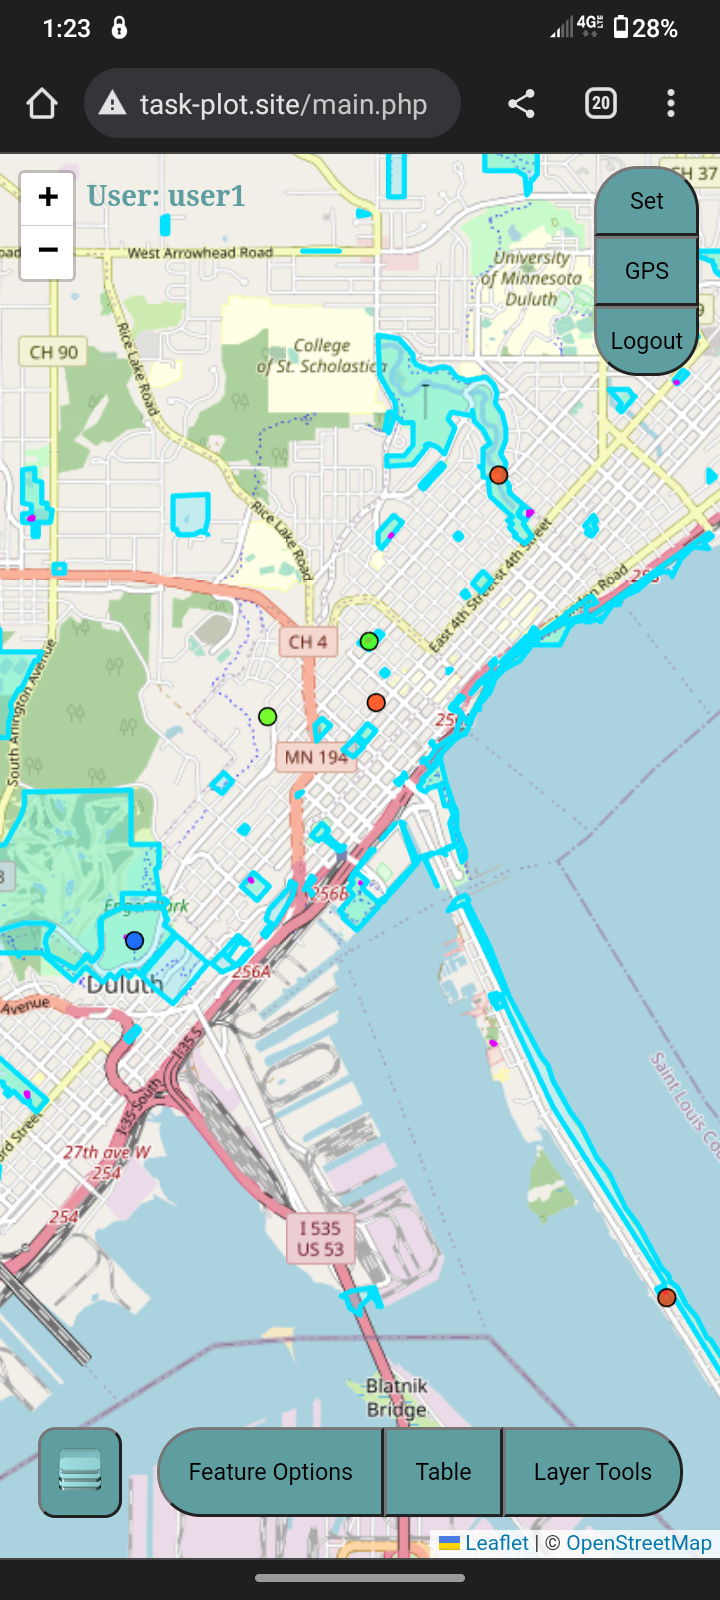
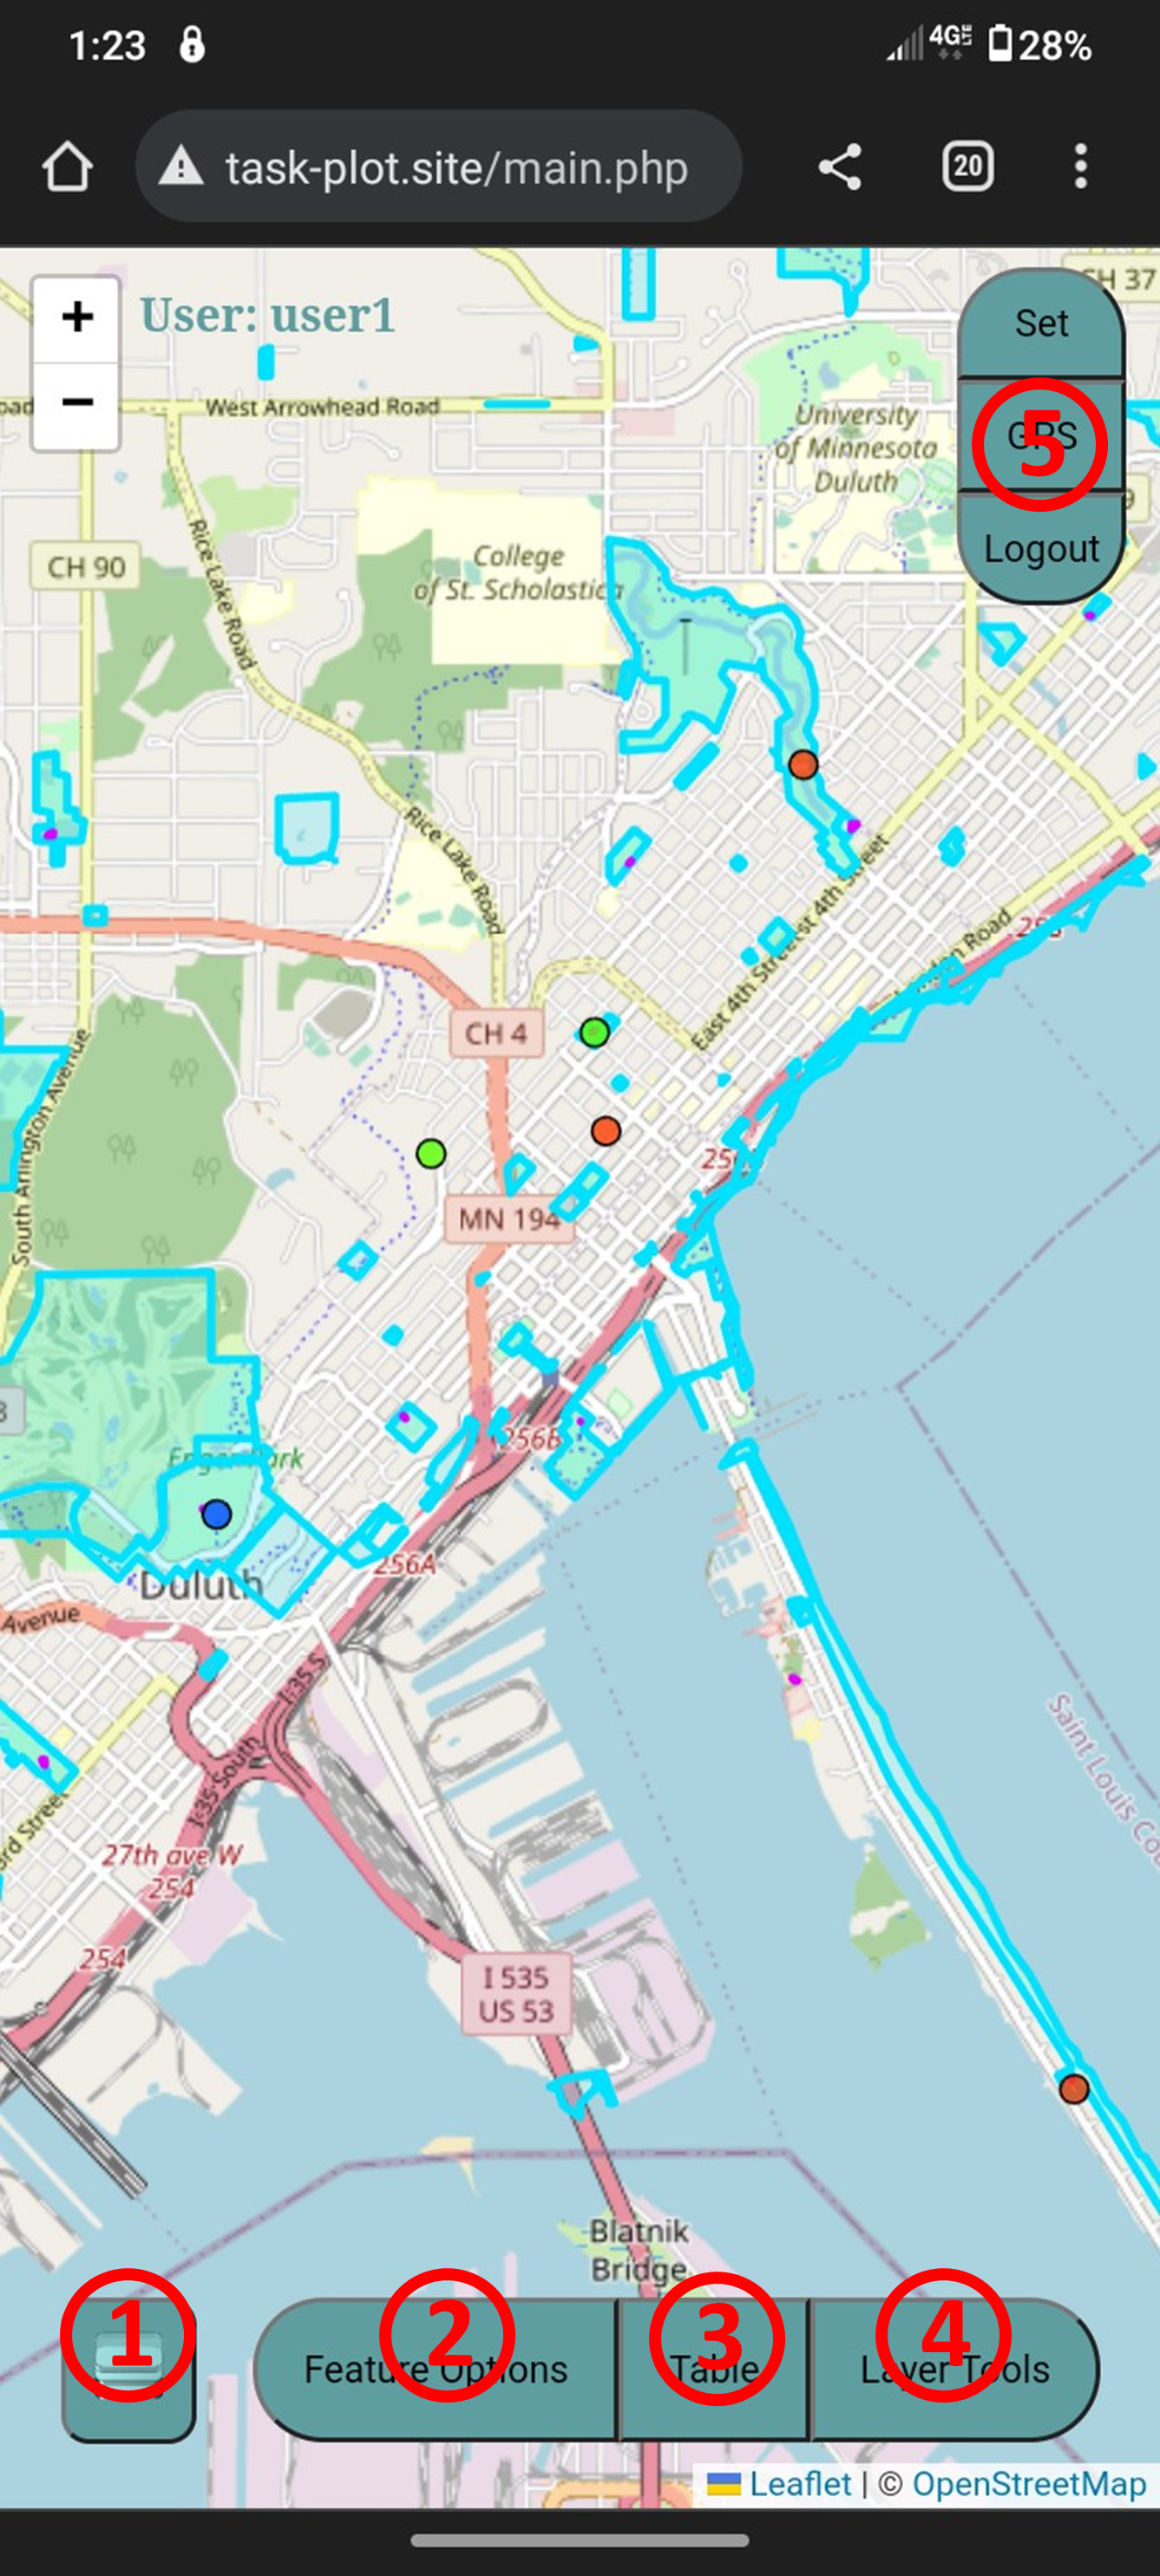
The imagery above shows what the application looks like on a mobile device after the user logs in. Top-level app features include:
Some important app functions are:
Created by Shane Omersa